Содержание
- Программы
- Фильтрация
- Просмотр диаграммы Гантта
- Рабочая область
- Поля списка задач
- Связанные задачи
- Поиск и фильтрация
- Диаграмма Гантта
- Создание связей
Bigpicture — плагин для Jira, разработанный для менеджеров, работающих с проектами. Предназначен для структуризации задач, объединения их в проекты и отображения в виде диаграммы Гантта.
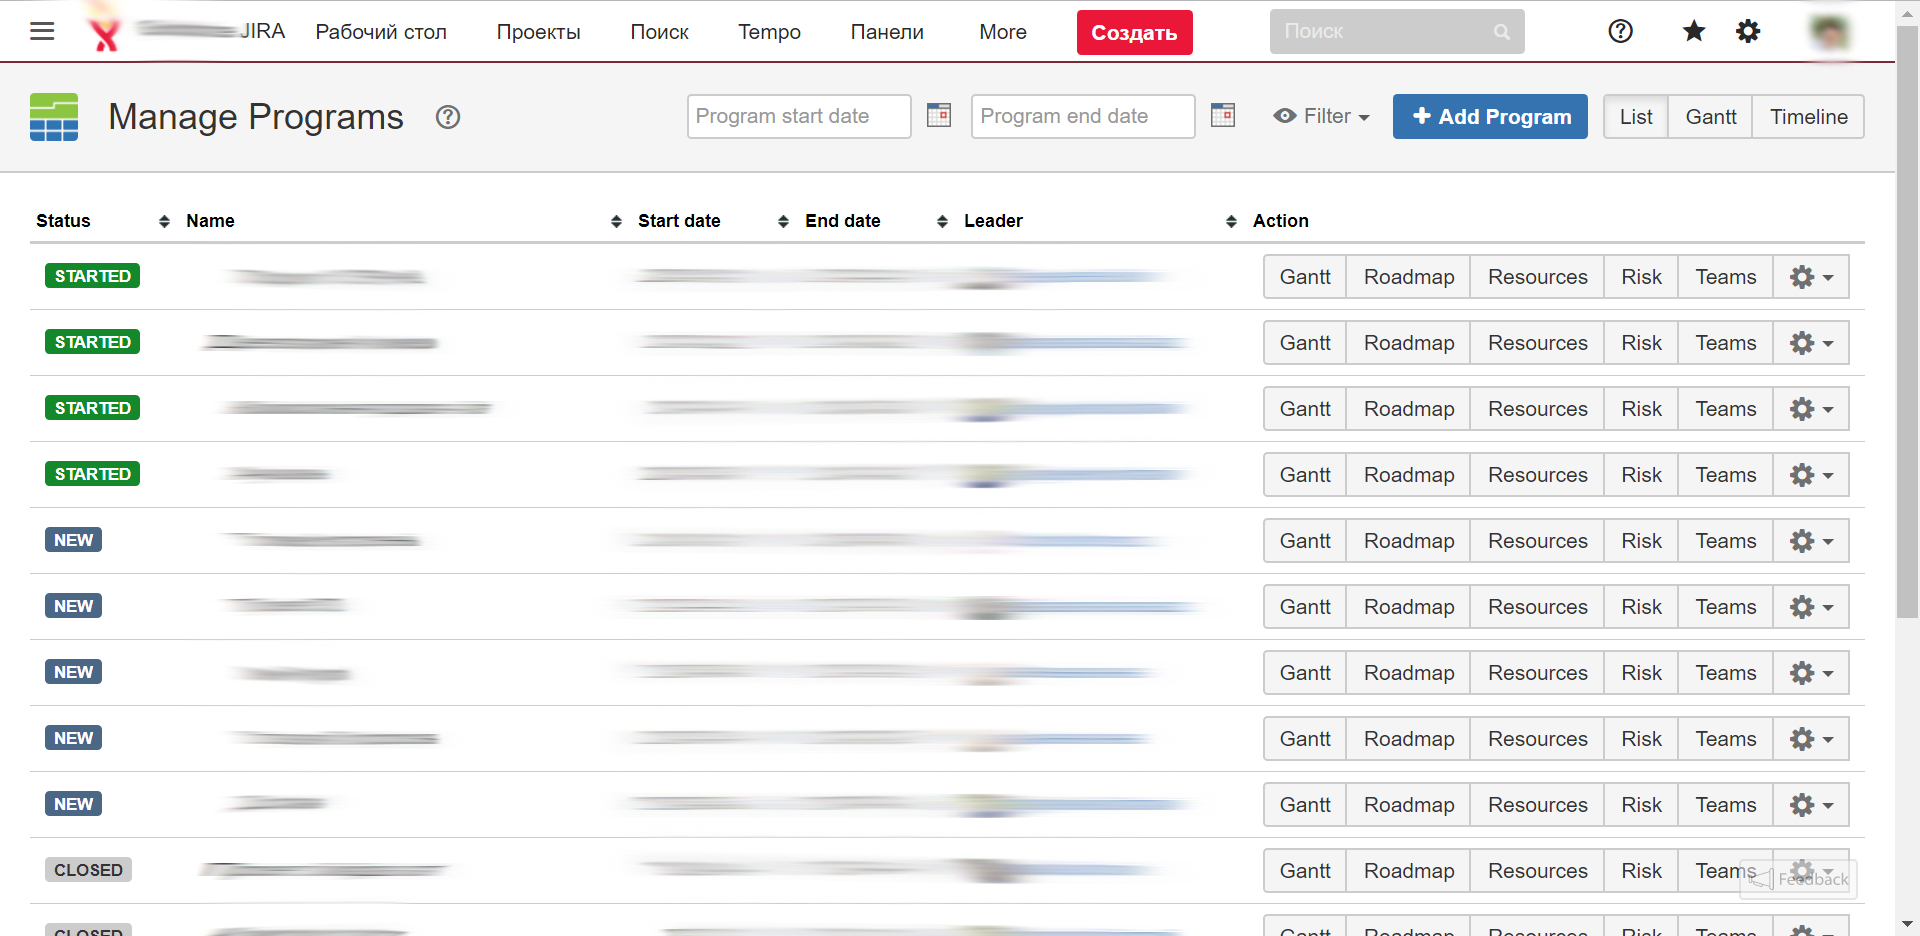
Программы
Раздел, в котором собраны все программы. Каждая программа формируется по конкретному списку задач.
Задачи могут быть из определенного проекта, иметь одинаковую метку или компоненту, быть связанными с определенной Темой.
Для каждой программы в списке отображается:
- статус;
- название;
- дата начала выполнения;
- дата окончания выполнения;
- ответственный;
- список действий для работы с программой.
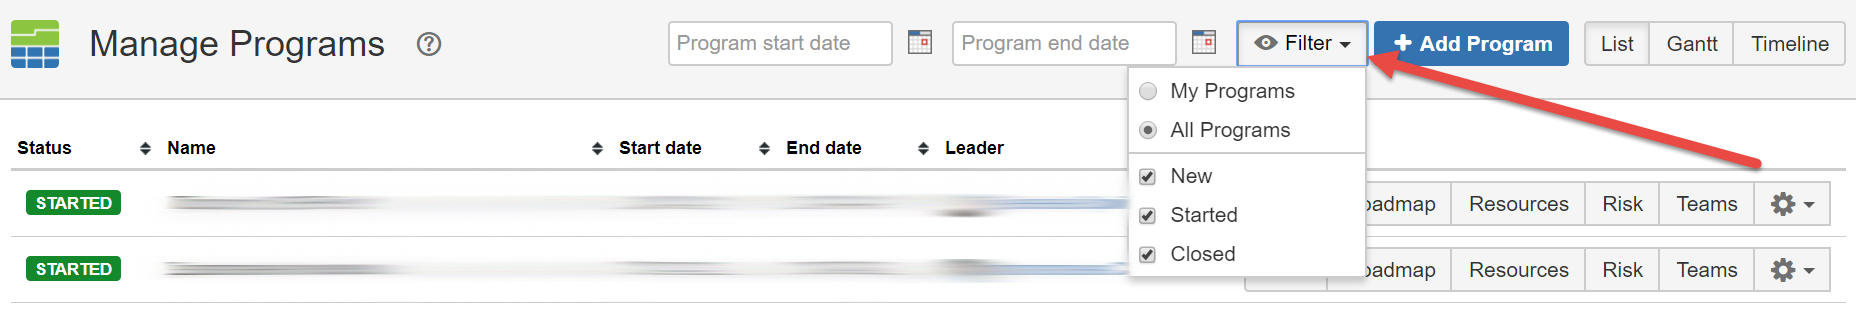
Фильтрация
Для большого количества задач необходимо иметь возможность отображать только те, которые удовлетворяют определённым условиям. Условия можно задавать с помощью фильтров.
Над списком проектов расположены кнопки фильтрации, с помощью которых можно отобрать и отобразить только те записи, которые соответствуют заданным условиям.
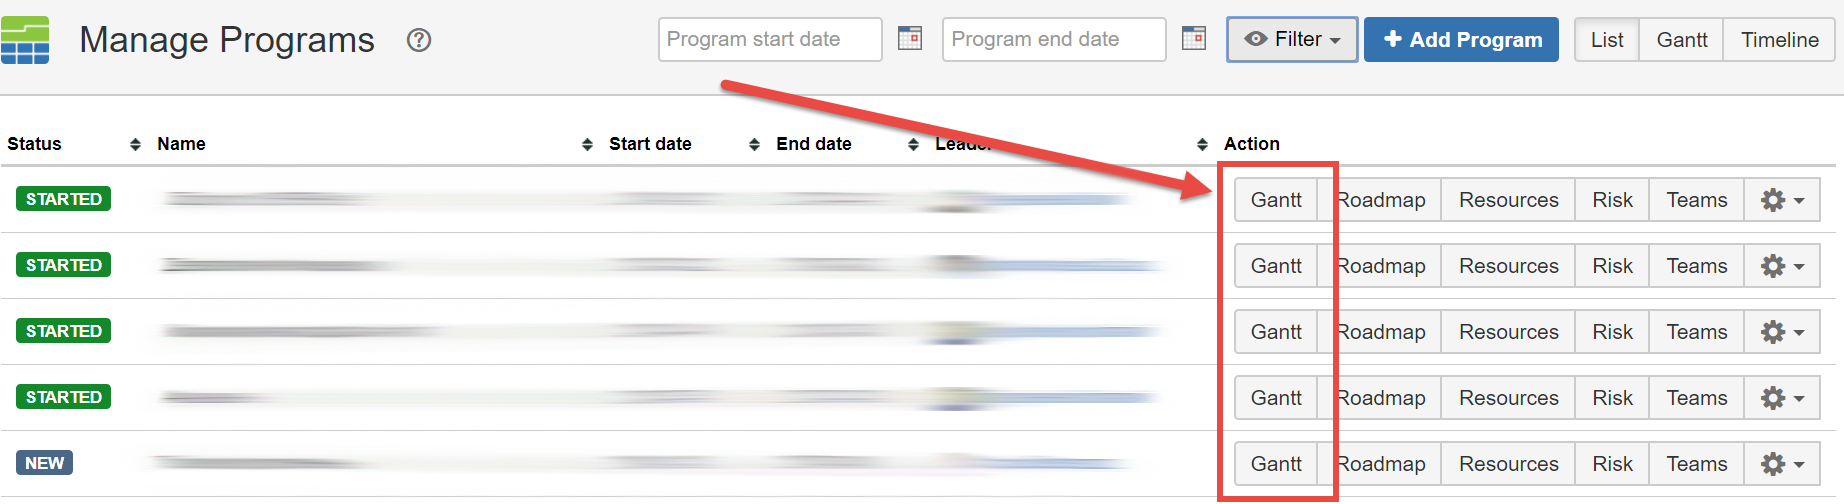
Просмотр диаграммы Гантта
Просмотр в виде диаграммы Гантта обеспечивает моментальную визуальную подачу информации обо всех текущих задачах. На одной странице сразу отображаются все этапы работы над задачами.
Чтобы просмотреть задачи в виде диаграммы Гантта, необходимо нажать в строке задачи кнопку Gantt.
Рабочая область
Рабочая область разделена на две части. В левой находится список задач, входящих в программу, и их параметры. В правой — диаграмма Гантта. На диаграмме Гантта задачи отображаются на шкале времени.
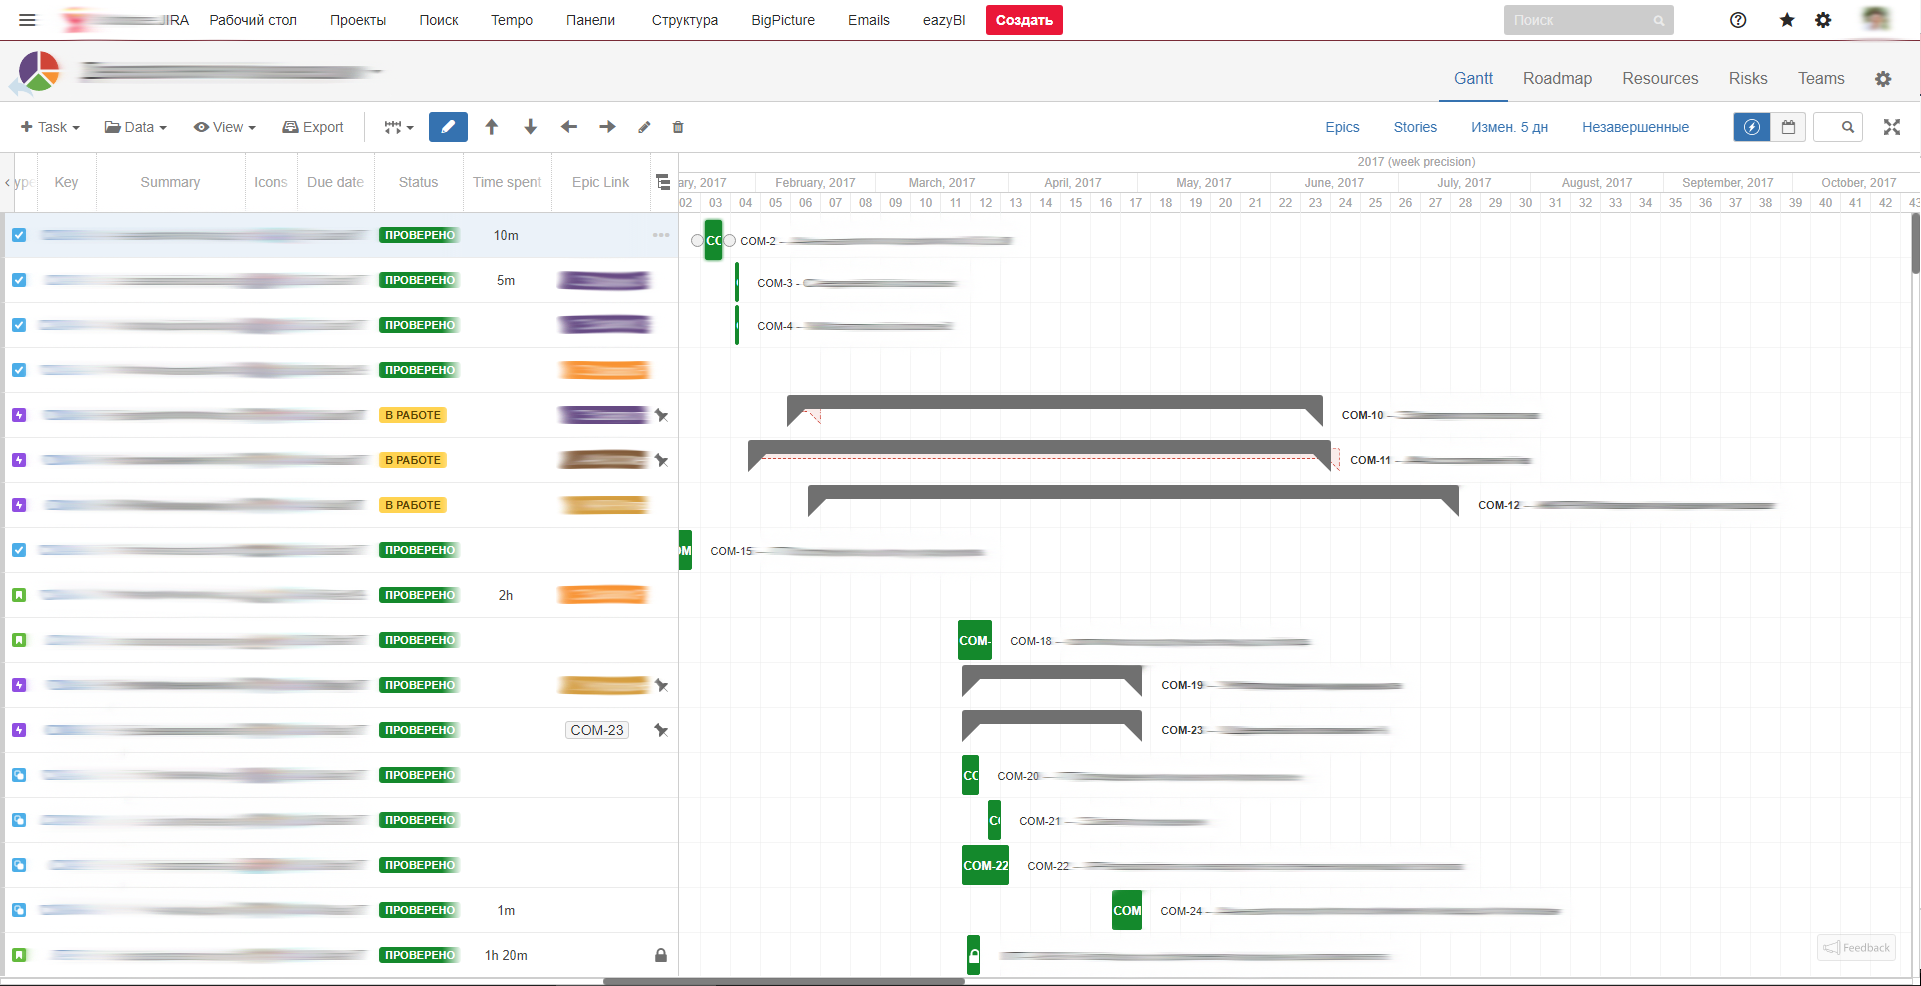
Поля списка задач
Для каждой задачи в таблице отображается следующая информация:
- Type — тип задачи;
- Key — идентификатор задачи;
- Summary — краткое название и описание задачи;
- Icons — поле с иконками, отображающими следующие параметры:
- На кого назначена задача;
- Приоритет;
- Принадлежность к проекту;
- Кто поставил задачу;
- Статус задачи (дублируется в поле Status);
- Тип задачи;
- Due date — дата, к которой задачу необходимо выполнить;
- Status — статус выполнения задачи;
- Открыт — работа над задачей не ведётся;
- В работе;
- Сделано;
- Time spent — время, которое уже затрачено на выполнение;
- Epic Link — ссылка на эпик, в который добавлена задача.
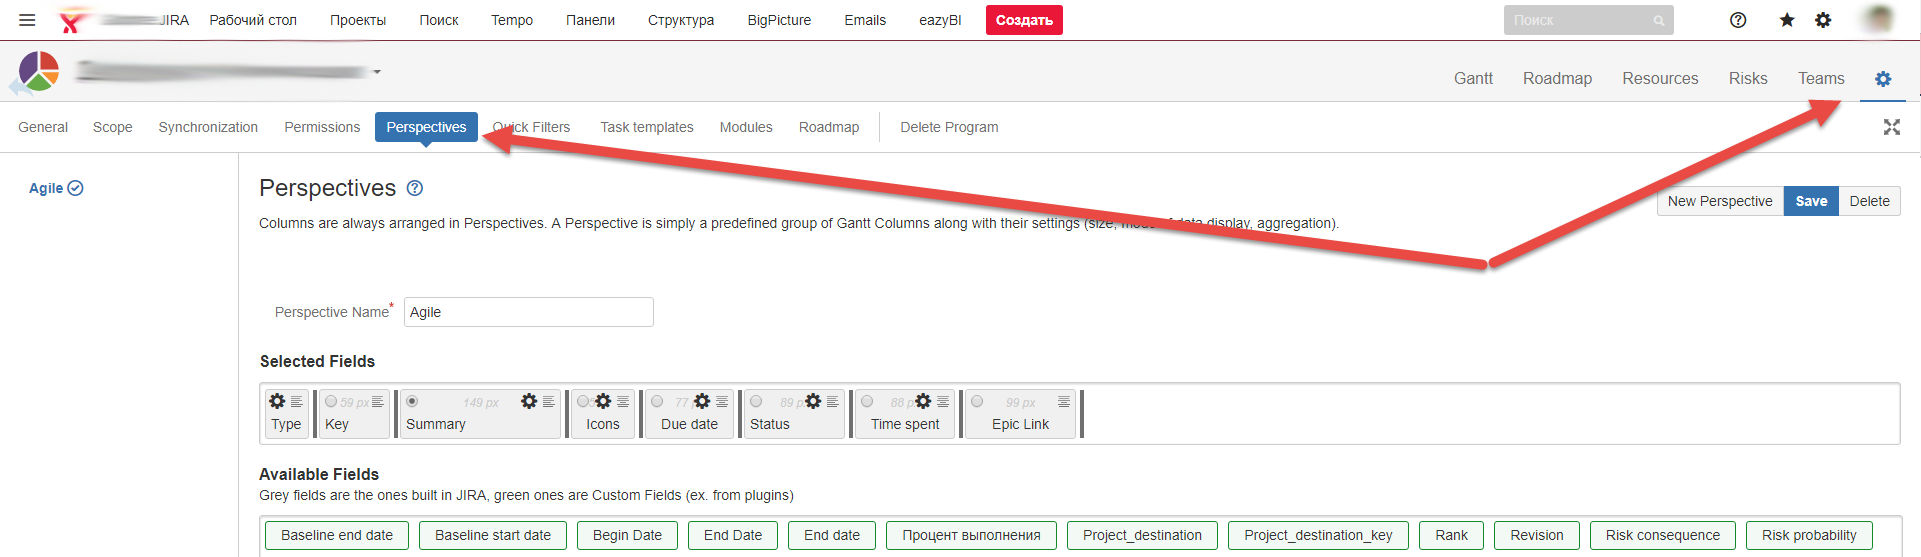
Управление полями
Отображаемые поля можно настраивать с помощью инструментов, доступных в выпадающем меню, открывающемся при нажатии на кнопку ![]() .
.
Связанные задачи
Если для выполнения одной задачи необходимо выполнить ряд сопутствующих, то это отображается в списке в виде дерева. Сюда могут попадать и задачи из других проектов.
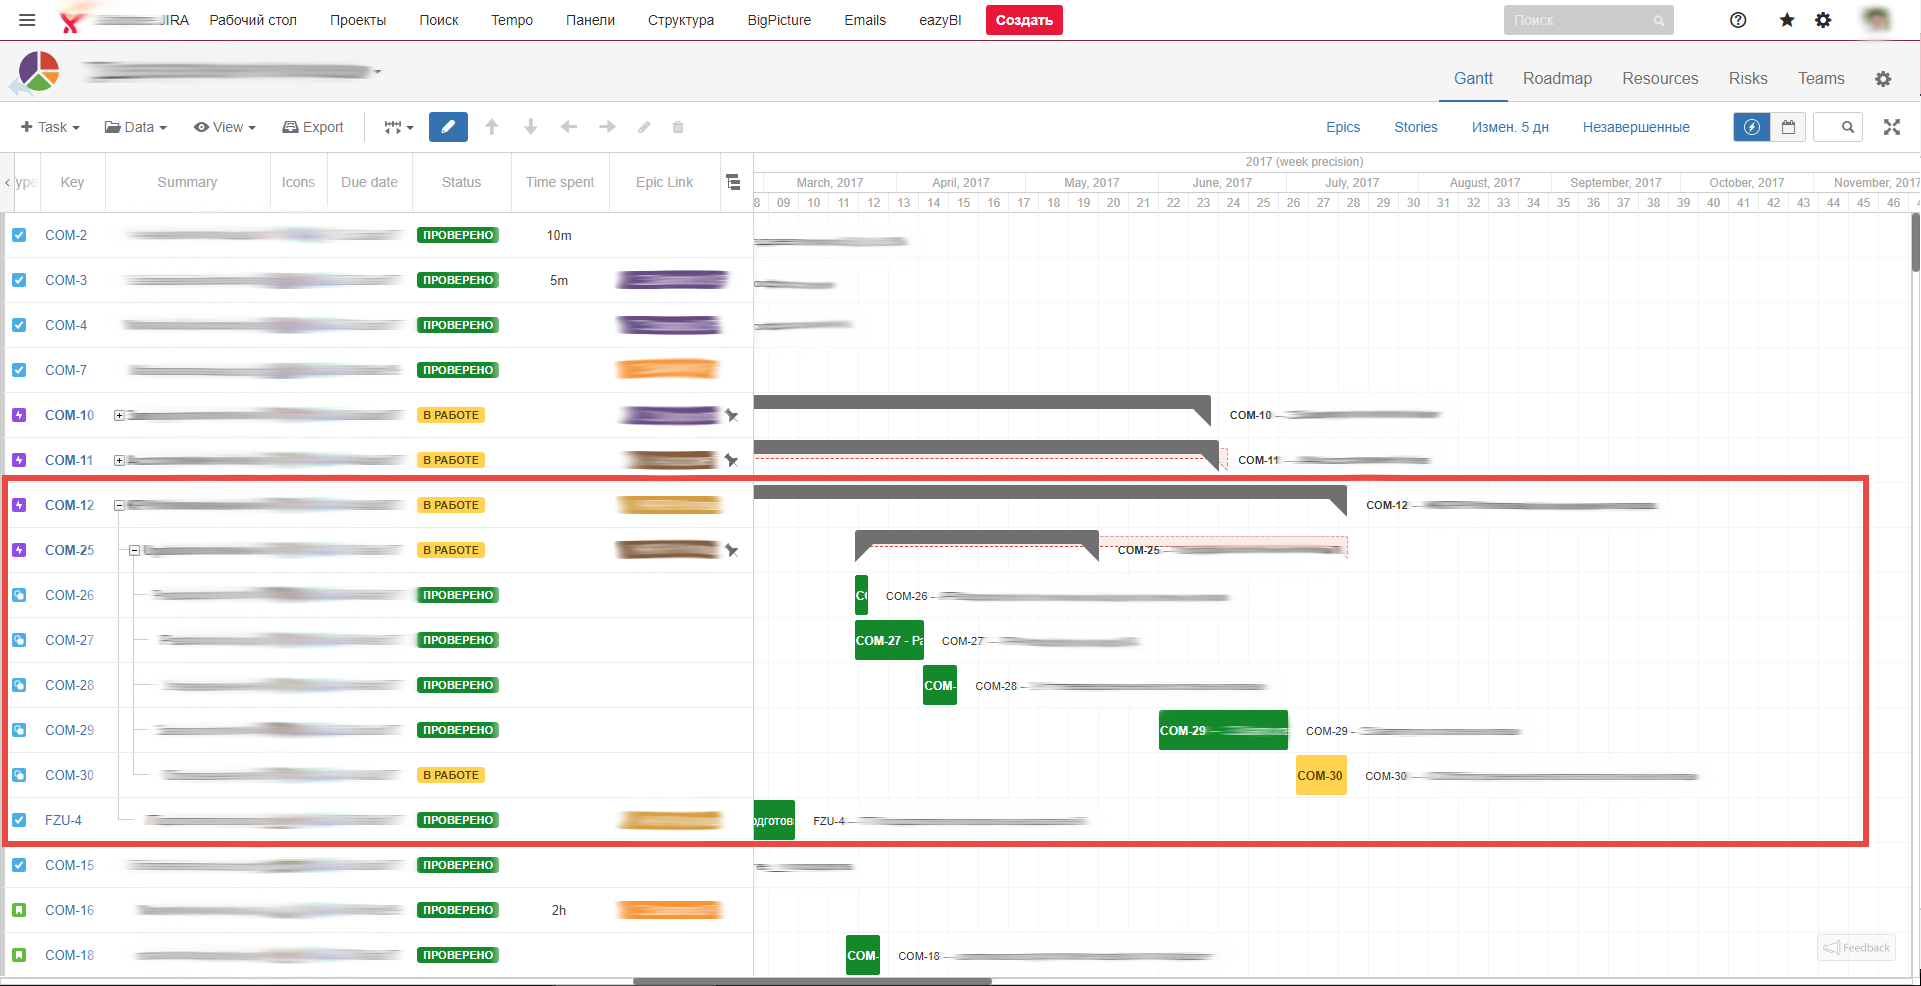
Если рядом с названием задачи есть символ +, то с этой задачей связаны другие. Посмотреть, какие именно, можно, нажав на этот +.
Чтобы изменить положение задачи на диаграмме или удалить её, необходимо выделить задачу и воспользоваться меню над таблицей.
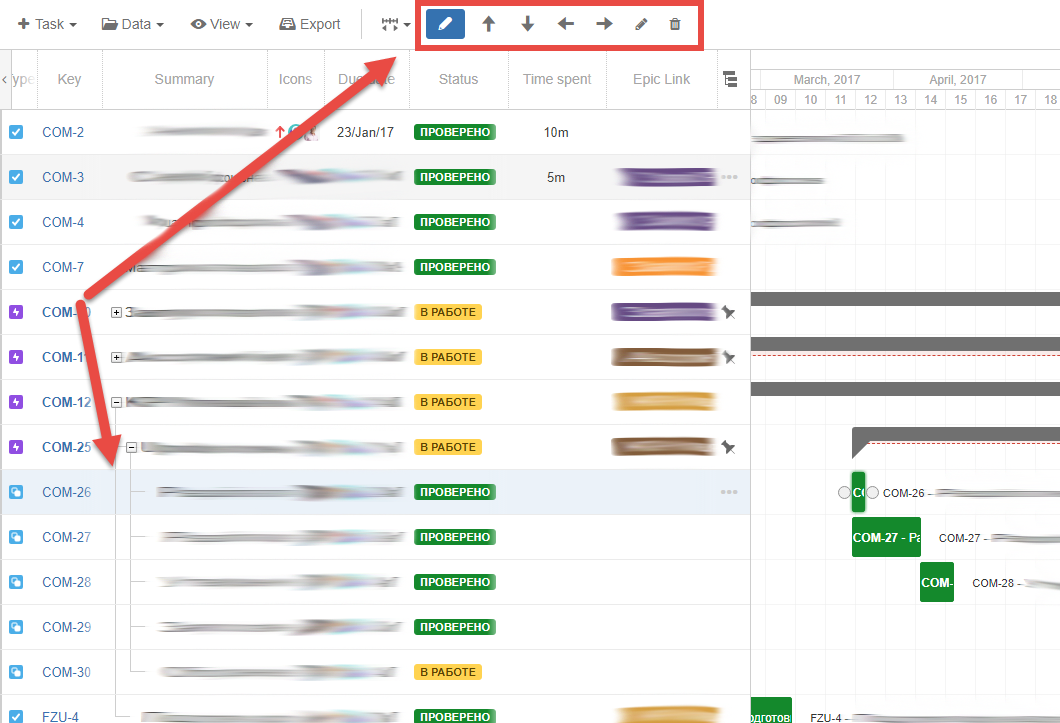
В этом же меню вы можете:
- Task — добавить задачу или подзадачу;
- Data — изменить сортировку, развернуть или свернуть, добавить линию окончания срока, обновить диаграмму;
- View — отобразить или скрыть дополнительную информацию на диаграмме;
- Изменить временной период, отображаемый на диаграмме;
- Редактировать положение задачи в списке.
Поиск и фильтрация
Над списком задач находится строка поиска и фильтров.
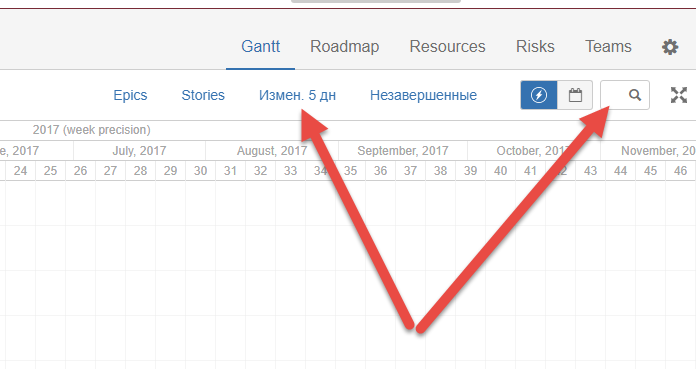
В поле поиска введите сочетание символов, которое может быть найдено в таблице и нажмите Enter.
По умолчанию добавляются следующие фильтры:
- Epic — показать только Темы;
- Stories — задачи с типом История;
- Измен. 5 дн — задачи, которые были изменены за последние 5 дней;
- Незавершенные — все открытые задачи.
Чтобы отфильтровать таблицу по выбранному признаку, необходимо нажать соответствующую кнопку.
Одновременно можно устанавливать несколько фильтров.
Чтобы снять фильтр, нажмите эту же кнопку ещё раз.
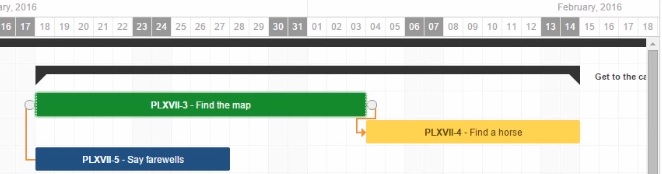
Диаграмма Гантта
На диаграмме отображается время выполнения каждой задачи, её статус и время, к которому её необходимо сделать. Статус соответствует значению в поле Status и имеет такой же цвет. Это позволяет с первого взгляда определить, очередность выполнения.
Каждой строке таблицы соответствует строка на диаграмме Гантта.
Задача, для выполнения которой необходимо выполнить несколько сопутствующих, выделена серым цветом.
Связи между зависимыми задачами отображаются на диаграмме.
Все объекты диаграммы можно перетаскивать мышкой:
- изменять время выполнения задач;
- перемещать задачу по шкале времени;
- связывать задачи;
- убирать связи между задачами.
Важно: При изменении сроков выполнения задачи старые сроки могут также отображаться на диаграмме в виде бледно-серого “следа”. Это позволяет отследить вносимые изменения.
Создание связей
С помощью плагина BigPicture создание связей между задачами можно выполнить в визуальном режиме, на самой диаграмме. Это значительно удобнее, чем искать в таблице две задачи. Используйте drag-n-drop между специальными маркерами, чтобы создать связь.
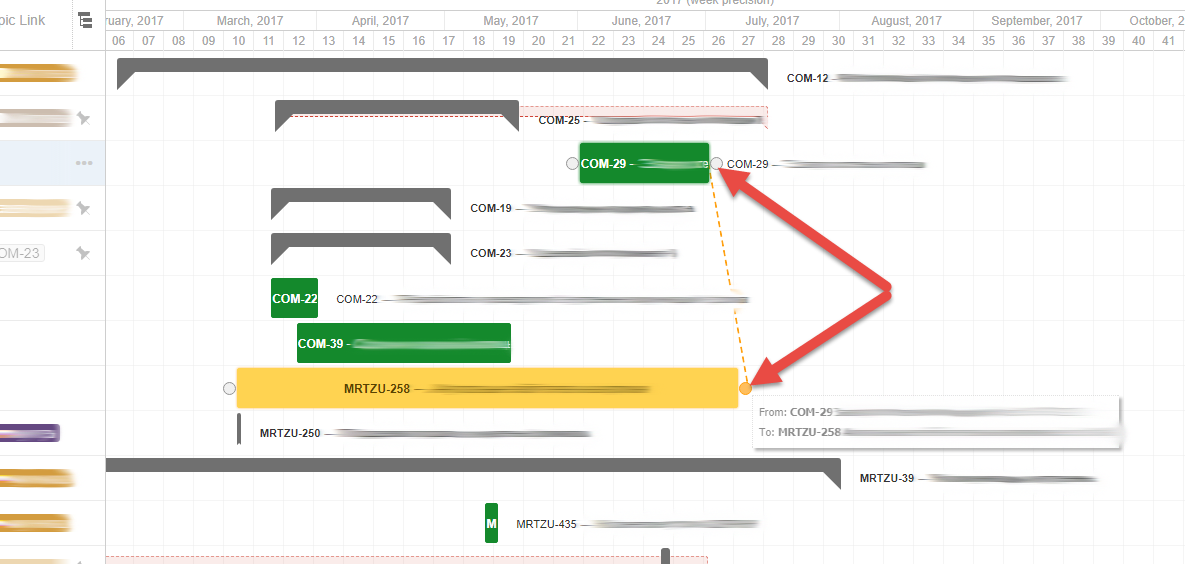
Уже созданную связь можно редактировать и удалять.
Jira is the most prominent project and portfolio management software used among all development teams across the organization. It eases the project management lifecycle by tracking all the tasks in one place. Jira also ensures compliance with auditing evidence and enables accurate statistical analysis through pre-packed customizable charts and reports. To further boost the functionality and add more features to the Jira software, add-ons or plugins can be additionally installed. One such add-on is called BigPicture that allows users to perform high-level project governance, manage portfolios, and create reports.
In this article, you’ll learn about BigPicture and how it can be used with Jira to perform project management operations. You’ll also learn about various BigPicture modules and how to establish install Jira BigPicture installation.
Table of Contents
- Introduction to Jira
- Key Features of Jira
- Introduction to BigPicture
- Key Modules in BigPicture
- Gantt Module
- Scope Module
- Board Module
- Resource Module
- Roadmap Module
- Teams Module
- Risks Module
- Reports Module
- BigPicture Pricing
- Key Modules in BigPicture
- Jira BigPicture Installation Setup
- Jira BigPicture Installation: Installing add-ons internally using Jira Software
- Jira BigPicture Installation: Manual Installation
- Conclusion
Prerequisites
- A basic understanding of the need for project management.
Introduction to Jira
Jira is used for project management, issue tracking, and bug tracking tool designed to handle team coordination in agile software and business developments. Jira software was launched by an Australian company called Atlassian in 2002. Since then, more than 65,000 companies have been using Jira for its excellent flexibility and project management approach. Jira has everything you need to manage teams and projects. It is fully customizable to user needs like customizing the workflow, creating the issue types, and designing the issue operation screen as per the team requirements.
Jira is unique from other project management tools because of its various add-ons used for different operations that enhance the project workflow. Jira software allows users to integrate with external systems, provide a detailed overview of team activities, and update the current status and function of the team periodically. Jira is applicable across various groups of an organization like development teams, project management teams, testing teams, HR teams, etc. Atlassian is the official marketplace of Jira, where users can find various apps and add-ons that are used to enhance the functionality of Jira.
Key Features of Jira
- Project Management: Project management has five phases: conception and initiation, planning, execution, performance monitoring, and project close. In Jira, more than 1300 plugins or add-on features are readily available to enhance the functionality for every stage of a project. These inbuilt features of Jira make the project management lifecycle more flexible and straightforward to the users or teams.
- Agile Development: The agile methodology followed by Jira is an iterative approach to software development and project management that helps the team deliver results faster and reduce the cause of errors. This methodology also focuses on project transparency by keeping track of projects in real-time, updating on the success and failures of tasks when the projects are completed. This systematic procedure allows teams to be self-organized and act based on feedback.
- No-Code Automation: Jira’s automation engine speeds up the work by automating repetitive tasks, increasing productivity in the project lifecycle. This no-code automation feature lets users create automation rules in Jira irrespective of their coding or technical knowledge. Users can set the rules that trigger the automation process, like mailing the manager when the task is completed.
- Report and Dashboards: Reports help the team analyze the progressions of a project, track the issues and deliver real-time insights about the current status of a project. This feature allows teams to make data-driven decisions to predict future performance. Dashboard feature organizes reports and tracks achievements in a single view within a Jira workspace. Users can create multiple dashboards from different projects and generate one massive overview.
A fully managed No-code Data Pipeline platform like Hevo Data helps you integrate and load data from 100+ Data Sources (including 40+ Free Data Sources such as Jira) to a destination of your choice in real-time in an effortless manner.
Get Started with Hevo for Free
Hevo with its minimal learning curve can be set up in just a few minutes allowing the users to load data without having to compromise performance. Its strong integration with umpteenth sources allows users to bring in data of different kinds in a smooth fashion without having to code a single line.
Check out some of the cool features of Hevo:
- Completely Automated: The Hevo platform can be set up in just a few minutes and requires minimal maintenance.
- Real-Time Data Transfer: Hevo provides real-time data migration, so you can have analysis-ready data always.
- Connectors: Hevo supports 100+ Integrations to SaaS platforms such as Jira, files, databases, analytics, and BI tools. It supports various destinations including Amazon Redshift, Firebolt, Snowflake Data Warehouses; Amazon S3 Data Lakes; and MySQL, SQL Server, TokuDB, DynamoDB, PostgreSQL databases to name a few.
- 100% Complete & Accurate Data Transfer: Hevo’s robust infrastructure ensures reliable data transfer with zero data loss.
- Scalable Infrastructure: Hevo has in-built integrations for 100+ sources that can help you scale your data infrastructure as required.
- 24/7 Live Support: The Hevo team is available round the clock to extend exceptional support to you through chat, email, and support calls.
- Schema Management: Hevo takes away the tedious task of schema management & automatically detects the schema of incoming data and maps it to the destination schema.
- Live Monitoring: Hevo allows you to monitor the data flow so you can check where your data is at a particular point in time.
Sign up here for a 14-Day Free Trial!
Introduction to BigPicture
BigPicture is the most prominent web-based tool for project portfolio management. It was developed and released in the year of 2014 by SoftwarePlant. In Jira, BigPicture is used as an add-on that focuses on visual representation and aggregation of project management tasks. BigPicture allows users to perform various actions like planning and managing projects, supervising the performance, and tracking the project’s current state. Using BigPicture, the project head or project manager can coordinate resources and distribute work among various teams where each progress can be managed and tracked simultaneously. It helps in managing complex and intricate tasks effectively by optimizing the workflow, which results in increased productivity.
Key Modules in BigPicture
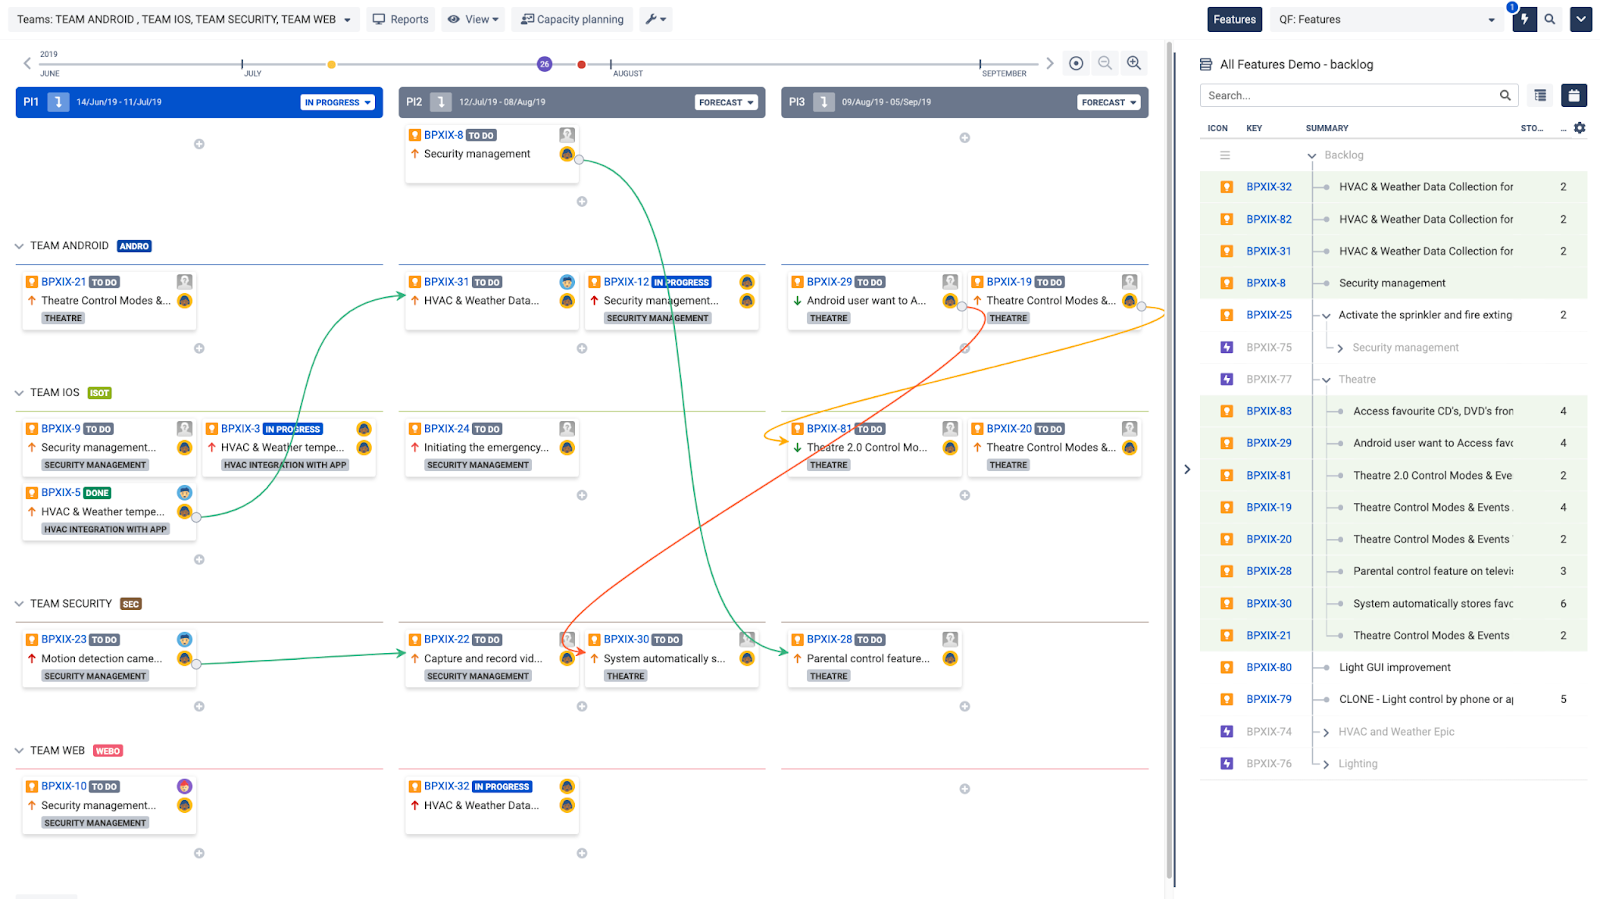
1. Gantt Module
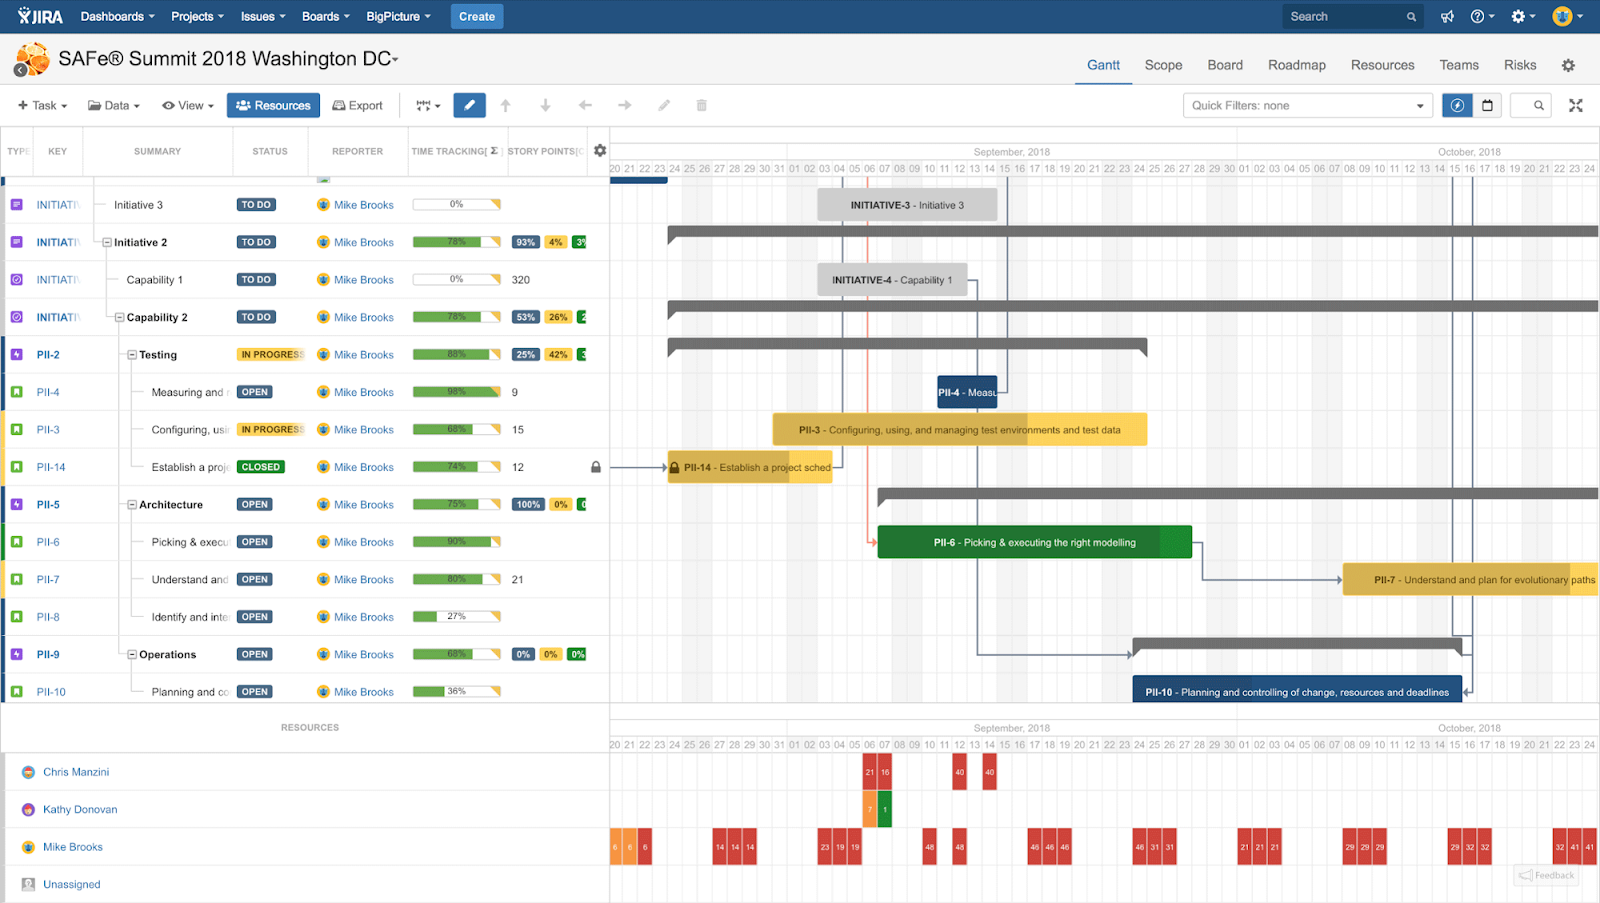
Gantt is the Generalized Activity Normalization TimeTable that helps in efficient project time management by planning and scheduling tasks for the team. In the BigPicture, the Gantt module is used to prepare project schedules or road maps, control the project execution, and generate reports according to the progress of the projects. The above image is an example where you can see the Gantt view on the right side and the task view on the left side. It helps users view the task hierarchy with their respective visualization. Using the Gantt module, all the management operations can be done in a single workspace where a user can alter and track all the undertakings at any granular level.
2. Scope Module
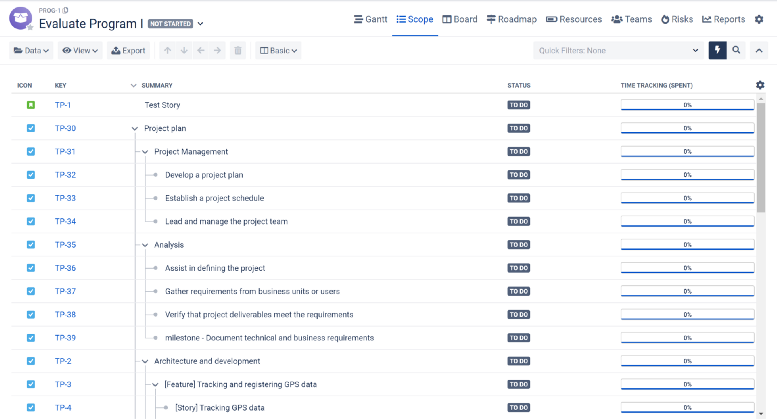
It serves as BigPicture’s core module for project management since it is perfect for viewing and managing the work breakdown structure of a project. It also has a quick filter option where a user can aggregate the module according to specific parameters. The scope view or scope module looks the same as the task view in the Gantt module but provides an option for inline editing like arranging columns and switching between views.
3. Board Module
This module visualizes the cross-team dependencies of a particular task of a single project. Using the board view, managers can confirm that the team is working as per the plan and isn’t deviating from the standard workflow.
4. Resource Module
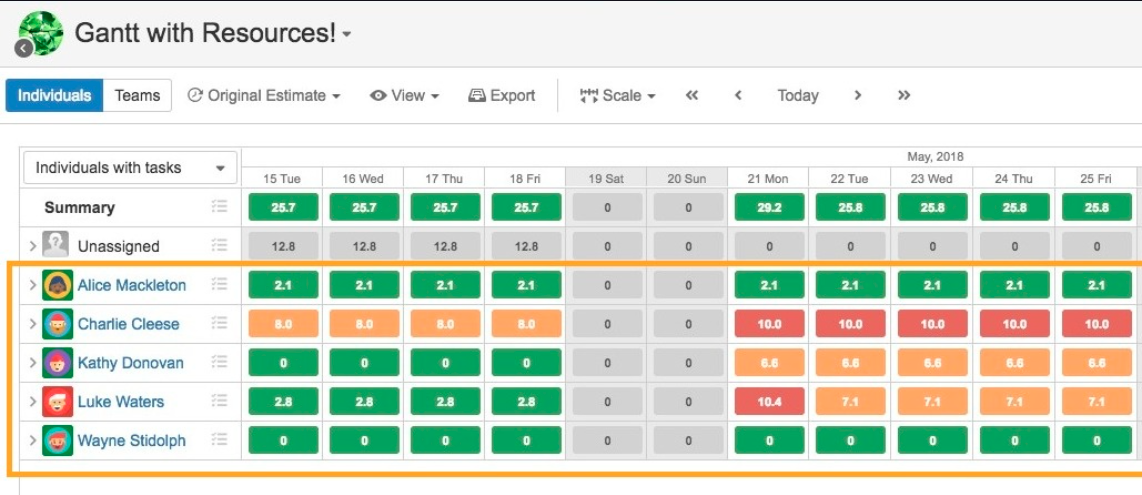
The resource module in BigPicture is built primarily for resource management in which project managers can ensure no one is under-allocated or overallocated with tasks. In the resource view chart, there are three color indicators — green, orange, and red. Green represents a user is correctly allocated with tasks according to their capacity, orange represents that the task allocation is slightly higher than the user’s capacity, and red represents under-allocated or overallocated with tasks. These color allocations are based on the estimates (time/week) that can be adjusted at the top of the screen.
5. Roadmap Module
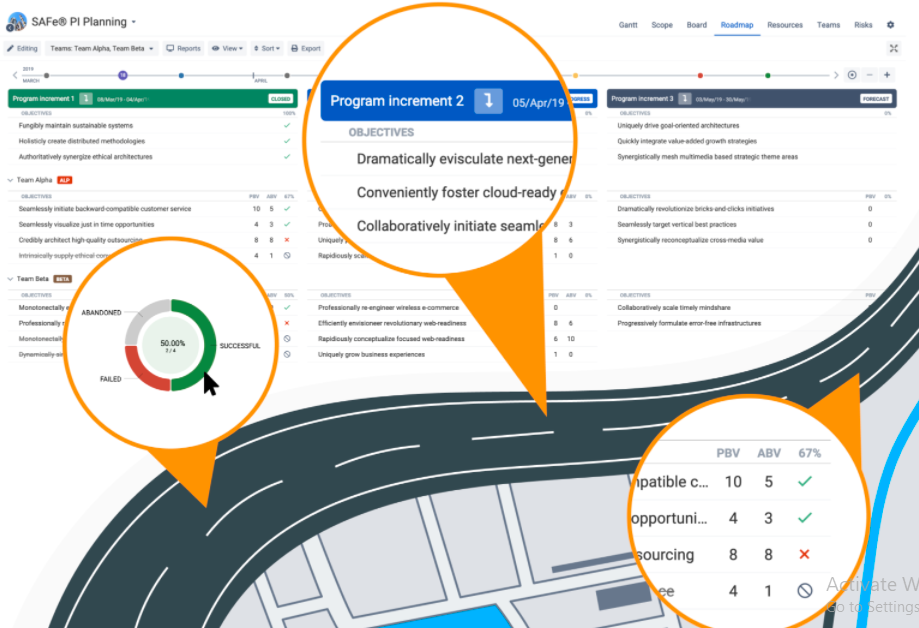
This module helps a user to easily track the mission and objectives of the projects. The Roadmaps module also guides the team to be aware of the steps they are taking to achieve the results. Program managers can change the order of objectives manually or set statuses of the task as open, completed, failed, or abandoned directly in the road map module.
6. Teams Module
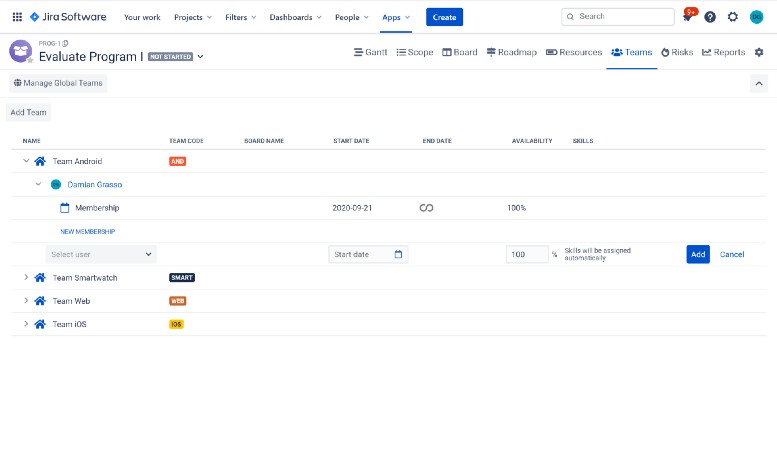
There are two types of teams in BigPicture — global team and program team. While the Global team members can work across any program or task, the program team members can only work exclusively for a specific program. Using this module, team managers can manage and organize the task’s starting date, ending date, skills, and availability of every member who belongs to the global and program teams.
7. Risks Module
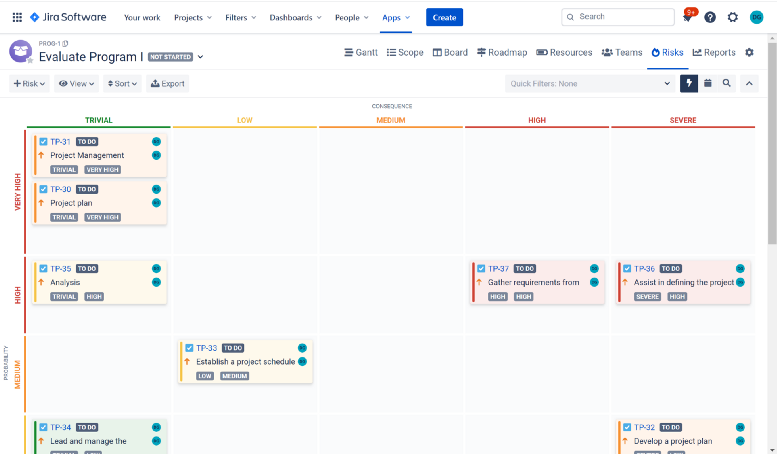
This module allows users to create a risk matrix that helps them to manage and categorize risks based on the task’s severity. It can visualize the risk of the specific tasks based on the heat maps. The heat map shows the risk of the task in three different colors — green, orange, and red, which represents the risk level for the particular tasks.
8. Reports Module
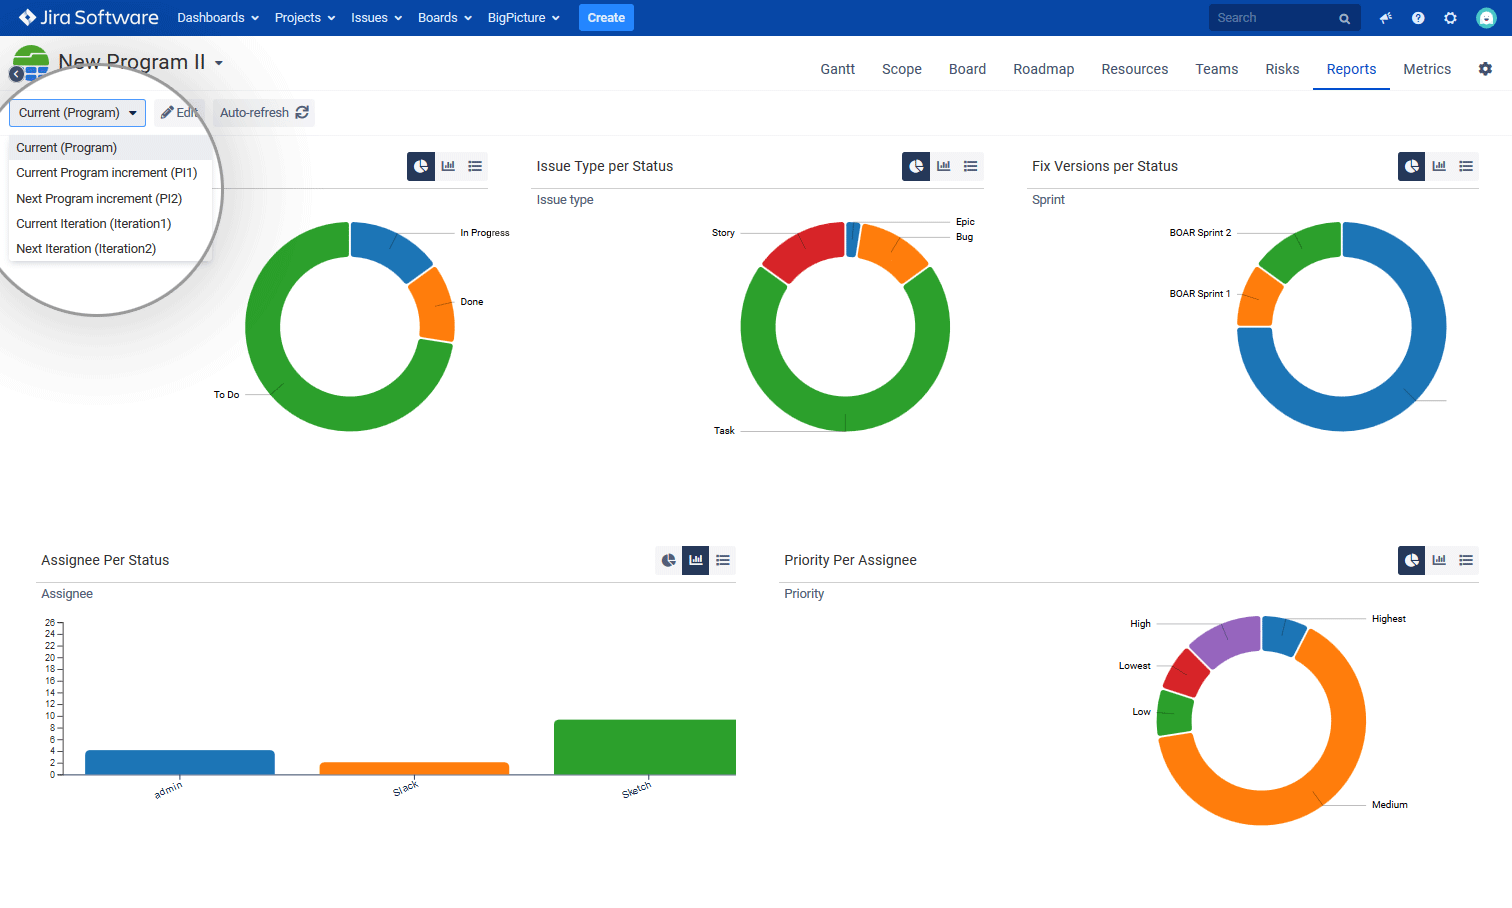
In this module, by default, users are provided with five predefined reports: task per risk level, issue type per status, fix version per status, assignee per status, and priority per assignee. These reports can be swapped between different kinds of charts for better visualizations.
BigPicture Pricing
Pricing varies according to the three types of Jira subscription plans as follows:
- Jira Cloud
- Jira Server
- Jira Data Center
Depending on the size of the team or organization, users can subscribe to the respective plans accordingly. For more pricing details, you can visit the link.
Here are the steps you can follow to set up Jira BigPicture installation:
- Jira BigPicture Installation: Installing add-ons internally using Jira Software
- Jira BigPicture Installation: Manual Installation
Jira BigPicture Installation: Installing add-ons internally using Jira Software
- Open your Jira software and log in using an admin account for Jira BigPicture Setup.
- Go to the Jira administrator.
- Click on manage apps.
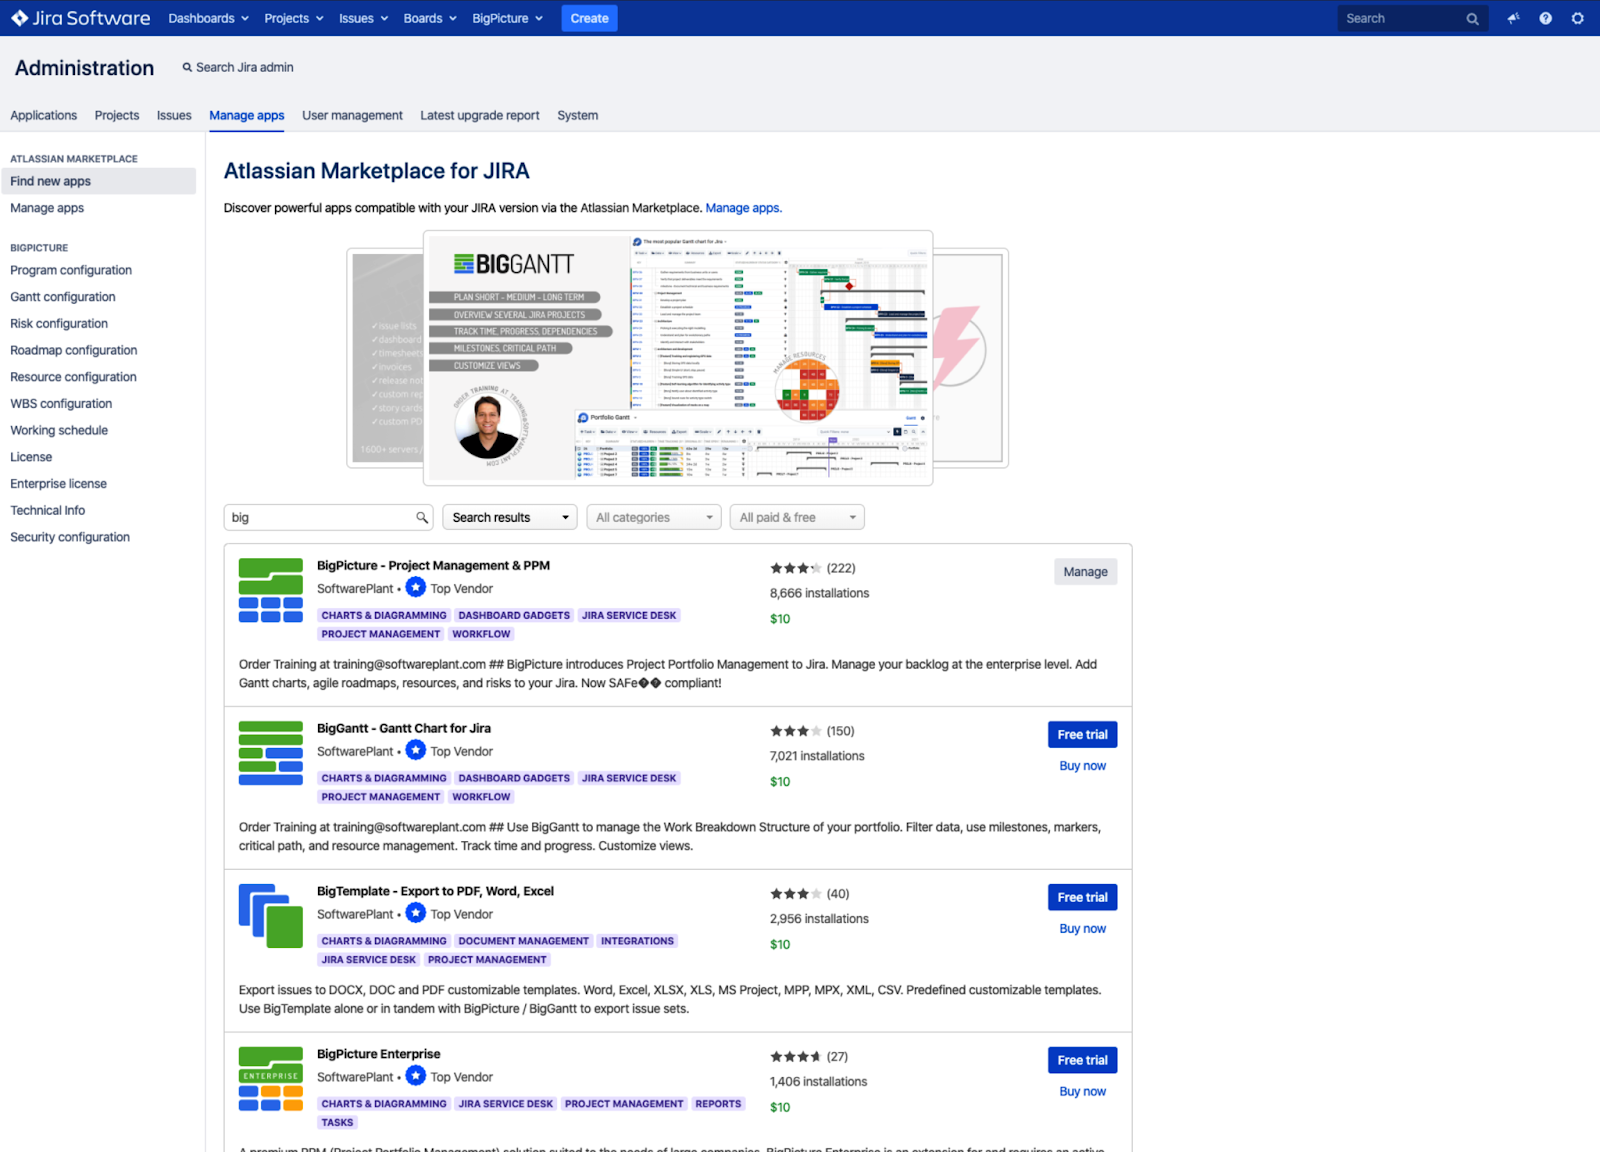
- Select Find New add-ons and search for BigPicture.
- Click on the ‘BigPicture – Project Management and PPM’ from the displayed options and install it.
Note: It is always advisable to install Jira BigPicture using Atlassian UPM (Universal Plugin Manager) that always installs the latest and most compatible versions with your Jira instance.
Jira BigPicture Installation: Manual Installation
The manual installation of Jira BigPicture can be done by installing the BigPicture add-on files separately. If your instance or computer is not connected to the Internet or when you want to test the specific version of the Jira BigPicture, you can use this method.
- You can visit the Atlassian marketplace website to find all the versions for a BigPicture add-on.
- Go to this website and choose your desired version of the Jira BigPicture Instance.
- Click on the version to expand its row and click download on the right-hand side.
- Now, the downloaded file is ready to be uploaded into the Jira instance.
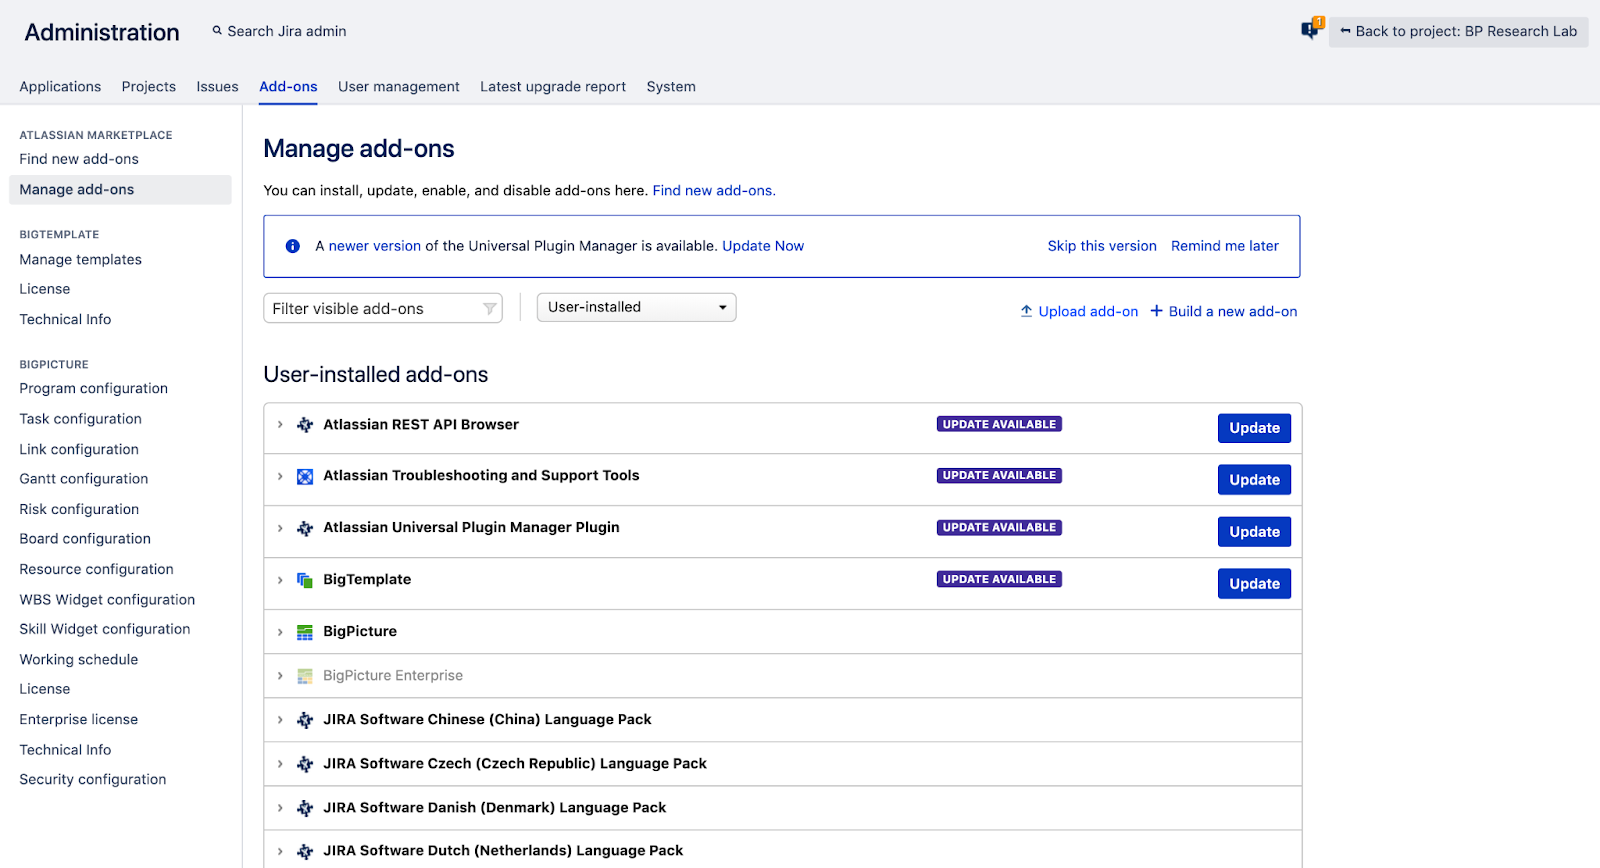
- Go to Jira Administration and click on add-ons.
- Then click on manage add-ons.
- Select upload add-on on the right-hand side.
- Now, the add-on is ready to use on your Jira software.
Conclusion
In this article, you have learned about the basic features and functions of the BigPicture add-on. It adds more value to the Jira software by generating project reports that help in effective resource governance and constructive risk management. However, Jira has many advanced features like automated forecasting and scenario planning that deliver end-to-end project management. By combining Jira BigPicture, users or project managers can confine the reports of a project to make it look better and present it effectively.
Extracting complex data from a diverse set of data sources such as Jira can be a challenging task and this is where Hevo saves the day!
Visit our Website to Explore Hevo
Hevo Data offers a faster way to move data from 100+ Data Sources (Including 40+ Free Data Sources) such as Jira, other SaaS applications, or Databases into your Data Warehouse to be visualized in a BI tool. Hevo is fully automated and hence does not require you to code.
Want to take Hevo for a spin? Sign Up for a 14-day free trial and experience the feature-rich Hevo suite first hand. You can also have a look at the unbeatable pricing that will help you choose the right plan for your business needs.
SAFe® 5.0 with Jira: Creating Agile Release Trains (ART) and Programme Increments (PI)

This is part of a series around SAFe with Jira; in this article we are going to talk about the creation of Agile Release Trains (ART) and Programme Increments (PI) using BigPicture for JIRA.
Note that we have used the correct UK English spelling of Programme for this context. The SAFe framework uses ‘Program’ in its literature as it is written in US English.
How to create Agile Release Train (ART)
The BigPicture for Jira plugin allows for creation of a hierarchy structure.
This customisable hierarchy can be used to adopt a SAFe-based structure including levels for the Agile Release Trains (ARTs).
Navigate to the ROOT (Home) directory within the hierarchy structure (or the desired level above the point where the new ART should be created).

Click the [+ Add new] button.
The create new Box form will appear – as shown below:

Type a suitable box name into the text box to represent the new ART to be created.
“Start date” and “End date” fields should be set to the desired values.


If desired, click on the Icon drop down menu to pick/select a different icon from the choices available.
If desired, click on the colour drop down options to pick/select a different colour for the default or newly selected icon.
Click the [Create] button to add the new Box based on the entered details.
The Create button will only be enabled when the necessary details have been entered.

The new Box as created for the ART will appear under the selected point in the hierarchy – as shown below:

If needed, multiple ARTs can be created under the same point in the hierarchy and/or added separately under different parent-levels within the hierarchy structure.
Generally, the ARTs would probably usually sit under their own programme or portfolio areas (rather than created at the Home level).
Multiple ARTs can run in parallel or run in a sequential series. The start dates and end dates are specific to each ART and can be set overlap those from another ART, if needed.
There may be a number of available options for adding different types of Boxes within the hierarchy – especially when using BigPicture Enterprise.
The available options may be different at different places and levels within the hierarchy structure (where availability and adding new options are managed via administration).
Other types of artefacts can also be created in a similar fashion within the hierarchy – as shown below:

Once the new ART has been created, the scope of what’s automatically included within this specific ART (or any other Box) must be added.
The new SAFe® ART needs to be “tied” to it’s own bespoke and/or shared set of Jira tickets or project(s).
Each ART will have it’s own specific setup to separate information (as needed).
You select the “Configure” option from the Spanner icon at the end of the row for the newly created ART – as shown below:

The box Configuration form screen will appear – as shown below:

Select the Scope definition option available under the “Tasks” tab – as shown below:

The specific data sets can be selected (by board, filter, project and task types).
Multiple values can be selected to pick across various data sets.
Data can also be manually added or excluded to suit.

The number of issues found will be shown in top right corner of the configure screen.
Click “Save” button to load these data sets into the specific ART.
The specific results will be loaded and shown within the Gantt view module for this specific ART program “Box” – as shown below:

Changes are bi-directional between BigPicture and Jira (where all updates are kept automatically synchronised in both directions)
How to create Programme Increment (PI)
Each of the ARTs usually will have a number of sub-phases – which are called “Programme Increments (PI)” which themselves would often span across a number of iterations or sprints.
These “programme increments” sit underneath the corresponding ART level on the hierarchy.
The PI’s always run in series order (finish-to-start) and not in parallel.
The start/end dates for the PI’s can’t be set to overlap within same point in the hierarchy (i.e. for PIs running under the same ART).

From the “Overview” module, you first select the corresponding ART and then add a new “box” for each of the PIs.
Similar to adding ART, you can add the name for the specific PI and the start/end dates.
NB: Predicted dates are offered based on previously added PIs (remembering that the PI dates can’t overlap under the same ART).
The icon and colour can also be amended to suit (i.e. same as for ARTs).

Configure the Programme Increment (PI) using Jira with BigPicture 8
Similar to the ARTs, the scope of what gets automatically included in the scope of the specific Programme Increment (PI) can be configured in the options (for each PI).
This allows a “sub-set” of the whole data as included in the scope of the ART to be automatically tied into a specific programme increment and/or also tied to a specific Team (if multiple teams being used in parallel).
These “ties” are usually based on another Jira field or custom field.

Dependencies within Programme Increments (PI) using Jira with BigPicture 8
Programme Increments (PIs) are key blocks underpinning the Program Board module.
Each of the delivery elements are clearly shown assigned within each PI and/or each team.
Dependencies can be added to give clear visual links between the elements and/or teams

Objectives for Programme Increments (PI) using Jira with BigPicture 8
Programme Increments (PIs) are key blocks underpinning the Objectives module.
Multiple objectives can be added against each PI and/or each team – with their percentage completion and/or progress tracked.
Planned Business Value (PBV) and Actual Business Value (ABV) for the objectives are also identified.

Adding ‘Architectural Runway (AR)’ using Jira with BigPicture 8
Architectural Runways (ARs) are also key artefacts within SAFe®.
Architectural Runway can be added into the same hierarchy (i.e. similar to adding ART in earlier section).
Each architectural runway will need to have it’s “scope definition“ set to include correct Enabler tickets (via the config icon option for the specific Architectural Runway box).

Conclusions and Next Steps
Agile Release Trains (ART) and Programme Increments (PI) together form the most essential parts of SAFe®.
Jira with BigPicture are excellent software tools which enable the creation, visibility, dependency linking and management of associated delivery elements throughout their lifecycles within and in-between the ARTs, the PIs and the Teams.
BigPicture enables SAFe® compliant hierarchies to be formed with all information kept bi-directionally synchronised with Jira.
Programme Board and Objectives modules were briefly mentioned. However, BigPicture includes a lot more functionality beyond what’s been covered.
As Atlassian Partners – TribusIT can help you to introduce or adapt your existing Jira setup to be the best solution for adopting SAFe® for your organisation.
We’re also partners with SoftwarePlant the vendors of BigPicture
Please contact us if you wish to see our other presentations or receive more details.
Watch out for further articles around SAFe with Jira.
If you found this useful – please share!
We use cookies on our website to give you the most relevant experience by remembering your preferences and repeat visits. By clicking “Accept”, you consent to the use of ALL the cookies.
You might get a collection of SAFe-related apps from Atlassian Marketplace, but why not get BigPicture 7 – an all-in-one SAFe-compliant project management app that will one day in the future unite Jira, Trello, Google Calendar, Git Hub and more? We’re proud of being the first Marketplace vendor that took that niche!
Let’s take a quick tour of the PI planning process in Jira + BigPicture.
Step 1
Set objectives at the Program Increment level on the SAFe compliant roadmap of BigPicture 7.
There are two types of goals at the PI level: (1) per ART objectives, represented by the top row on the illustration below, and (2) per team ones.
More: Objectives’ lifecycle

Related note 1: how does BigPicture deliver on the SAFe’s top ‘Portfolio’ level? Currently BigPicture gathers ARTs, or programs, in the proven Program Manager to show at a glance that, say, ART 1 is 60% finished, while ART 2 is only 20% complete, and so on. However, the more flexible Schedule module will replace the Program Manager in the near future.
Related note 2: how to manage high-level epics in Jira + BigPicture + SAFe? High-level epics tend to span several Program Increments, so should a single epic act as an objective for several consecutive PIs? Well, there is an alternative: create a separate project in Jira, then assign those high-level epics to it. Now set up a simple ‘To do — In Progress — Done’ Jira board and manage those epics there.
Step 2
Not sure what to plan for the upcoming Program Increment? Consult the Scope module of BigPicture 7, i.e. the work breakdown structure of the entire program, that should have been born earlier in the project’s life. Employ epics or stories as PI goals, rather than granular sub-tasks – and put them on the roadmap.
More: How to look at Scope

Step 3
On a related note – be aware of the new SAFe compliant Program Board 2.0, a.k.a. dependency board, that will debut in BigPicture early in 2019. At the PI level, pictured below, the Program Board 2.0 can supplement the roadmap shown in Step 1.

Step 4
Now that the PI planning is over, and the Program Increment has commenced, you face the more granular iterations planning, typically every 2 weeks. You will use a dependency board for planning iterations.
The fully SAFe-compliant dependency board with both ‘PI’ and ‘Iteration’ levels — pictured below — will arrive in Spring 2019. For now, however, use the proven simplified version of the board that covers the ‘Iteration’ level only. Check its documentation.
When both the PI and the Iteration planning is over, how will teams, left on their battlefields, know what tasks they are expected to complete? They can take one of the two paths:
- ‘get things done’ approach: BigPicture dependency board will ‘send’ tasks to each team’s native Jira Software board, the one available from Jira’s ‘Boards’ menu item. The team will only see their own tasks on the Jira board and not other team’s tasks. And obviously, as the Iteration is coming to the end, the BigPicture’s dependency board will keep in sync with each teams’ Jira Software board.
- a team can also stick to the BigPicture’s «main» dependency board. This approach, on the other hand, promotes keeping aligned with other teams, thanks to the inter-team task dependencies, i.e. those red and green arrows, that will be evident to everyone in the course of the Iteration (see step 5).
Note the Backlog pane to the right of the below screenshot — agile teams are free to add more work anytime during an iteration, capacity permitting.

Step 5
With the Program Increment progressing, more often than not teams will realize that they can’t complete all the goals set for the PI. Make their life easier with dependencies available in the BigPicture Program Board. What does the red arrow on the below picture say to a Scrum Master or project manager? The task that the dependency originates from is likely badly delayed already. The green arrows, on the other hand, mark dependencies that, for the moment, make no threat to the plan.

Step 6
Remember the risks of a project? An epic, story or regular task could pose a risk. Pictured is the Risk matrix of BigPicture.
Risks should have been identified and put on the matrix early in a project’s life, shortly after the work breakdown structure, or the scope of the project had emerged. Keep an eye on the risk matrix and amend it anytime during the lifespan of the project.
Obviously, a SAFe knowledgeable project manager will notice that the below matrix is inconsistent with SAFe’s ROAM technique (Resolve, Own, Accept, Mitigate), but the axes, as well as the values, are fully configurable in BigPicture.
This step is optional for simple projects. More: Risk management in BigPicture

Step 7
As the PI comes to an end, mark the objectives on the BigPicture roadmap as ‘delivered’ or ‘failed’.
Note how the ‘PIV-2 Testing’ task must have been added as a goal in the course of the Program Increment 3. The PI-level goals, however, are rarely made of ‘regular’ tasks from the backlog. Rather they are cast and formulated during the PI planning sessions.

Besides…
Keep an eye on resources. Illustrated is the resource module of BigPicture. Note how both individuals and skills are overallocated starting 17th of September — the red color stands for this.
More: How to interpret Teams view of Resource module

Although the Gantt chart, in theory, doesn’t belong to agile project management and to SAFe in particular, many project managers do use it. The bar chart lets us do two things:
- confirm whether objectives set for any given PI correspond to high-level goals, milestones or deadlines that had been embedded on the timeline of the Gantt chart for the given period,
- visualize tasks more precisely. For instance you could plan some granular task, such as ‘Call a client’ for Monday through Tuesday rather than for ‘anytime during a 2-week iteration’.
As a bonus, you’ve got this compact resource pane at the bottom of the Gantt chart.
 More: How to look at Gantt chart
Ready for SAFe ‘Program’ and ‘Portfolio’ levels with no ‘ubersoftware’?
Also keep in mind that the big picture delivering apps bet on performance and high availability. BigPicture has six people in the helpdesk alone 
Risk Management in Jira using BigPicture
https://geniusgecko.com/wp-content/uploads/2020/09/thumbnail-yt-2.png
1280
720
Przemek Ciesielski
Przemek Ciesielski
https://secure.gravatar.com/avatar/671740bfd56292a1c634a14dd3e79810?s=96&d=mm&r=g
12 September 2020
12 September 2020
In this article, we will discuss risk management in Jira using the BigPicture app, which is one of the best project management apps that you can find in the Atlassian ecosystem for JIRA.
We will show you the risk module, which is situated on the screen below:
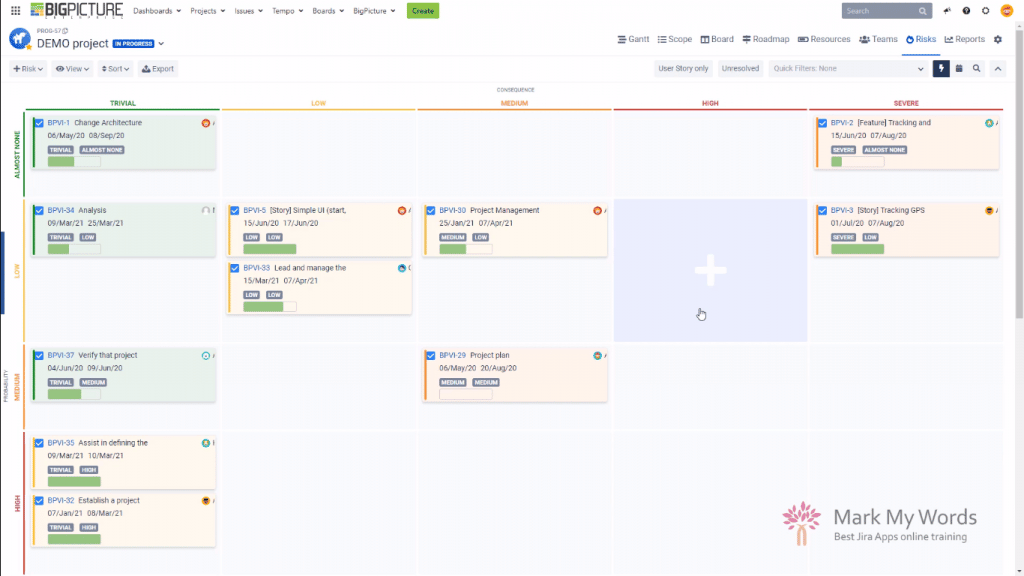
From this article, you will know how the risk module looks like, how to use it and how to use it correctly? What information can get out of it? What does it bring to the table? Let’s go!
It’s worth noting that in BigPicture there are several modules available: Gantt, Scope, Board, Roadmap, Resources, Teams, Risks, and Reports. The Risks is the module that we will be interested in today though.
Simplicity is King
Almost everybody likes the Risk module. It’s a surprise to me because I think that this kind of risk management is pretty simplistic. But at the same time, it turns out that not many companies want to have a robust risk management solution. They want a place where they can store the risks, review them from time to time, and react based on the information they get.
First of all, it’s worth noticing that the Risk module contains two different views, and they are listed over here:

There is a matrix view and a table view. You can work with both of them, or you can work on the one you prefer. Both of them show you the same set of data, so it doesn’t really matter whether you’re looking at the Matrix or the Table view.
Risk categories and connection to Jira
It’s worth noticing that risks in the BigPicture are based on two values primarily, a risk consequence and a risk probability. These two values, first of all, determine that the task or a Jira issue is a risk, and then it also, of course, decides where the issue is going to be placed on the matrix.
You probably know, that Jira is based on issues. And also, the BigPicture is a tool that is working on those issues coming from Jira. It doesn’t create its own risks. It allows you to import issues from JIRA, which means that you are continually working on Jira data.

What’s more you can also reach those issues from outside of BigPicture. You can create a custom report out of those risks. You can grab those risks and import them into another Jira app. You can even reach into those risks with the API and capture them to an external app for integration purposes. It provides you with all kinds of flexibility that we personally really like from our software solutions.
2 different approaches to creating risks
OK, so we know that we are working on issues. We know that two primary values need to be provided for an issue to be considered a risk. All that’s left to know is that the risk, or the issue that should represent the risk, needs to fall into the program’s scope that we are looking at right now. Then creating risks and managing them is pretty straightforward, and that’s the beauty of it.
But then you might also wonder – if the risk is a Jira issue, then should I use standard isue types, or create my own? There are different pros and cons of both approaches. I dive into them in more details in our training for the BigPicture app. (You can find it here)
Adding a task that already exists in your project plan is easy. With just a few clicks you select the issue you want to add to the Risk module, provide consequence and probability values and that’s it. You can of course also create a brand new issue, no problem here as well.
The second approach is to create your own issue type, a separate one exclusively assigned to be a risk. And that’s the approach I prefer because it gives you a very nice distinction between everyday Jira tasks and the risks. It gives you more freedom. You can still provide all the values on the level of that risk issue, add your own custom fields, you can also connect this issue with all the tasks, user stories, whatever that this risk touches, or is connected with by a standard Jira link.
Adding a new risk to the registry

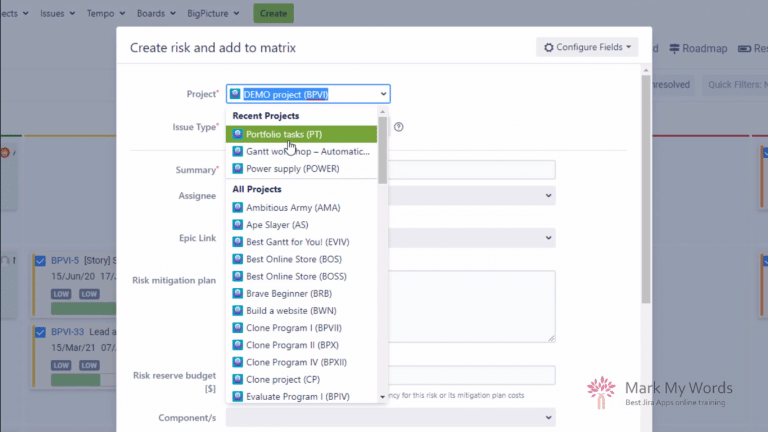
The scope of my box is the demo project, I need to make sure that it’s selected. The issue type that I am interested in is the risk issue type. It’s the one I have created, or I might have asked my admin to create for me. Please notice that there is some customization connected with this issue type. My regular issue would have all of those fields, there are plenty of them on the screen below. You probably would like to limit those fields to only the ones you are interested in when you’re thinking about risks though. But I have created 2 new fields for me that are available only on this risk issue: “Risk mitigation plan” and “Risk reserve budget”.
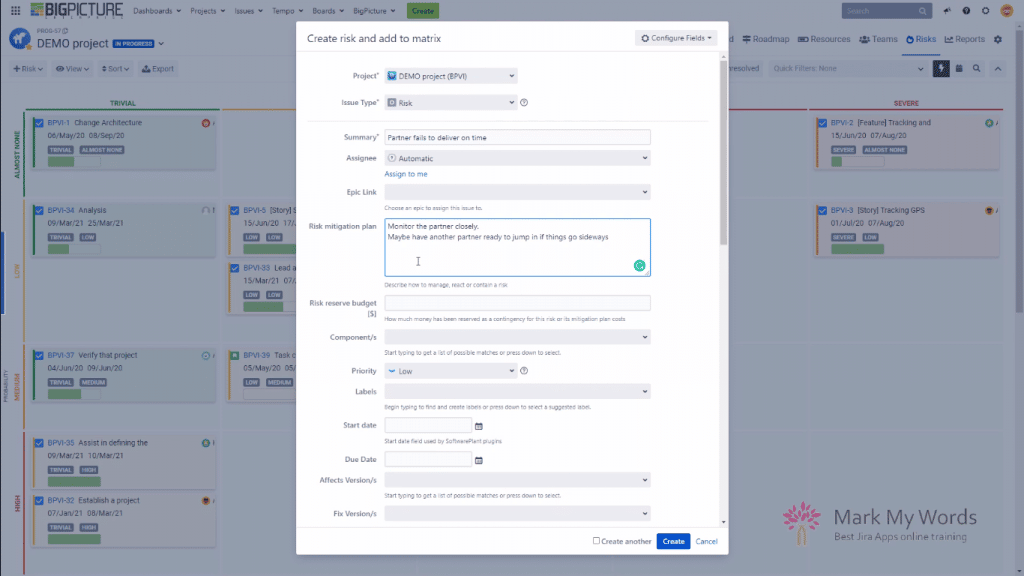
I can fill in my mitigation plan and have it ready for all the status meetings and risk review meetings. The second field is a numerical field used for creating a reserve as a contingency for times when things do go sideways. This money is booked for me somewhere in my budget to react to the risk that has materialized.
I guess it’s worth noting, that after the risk gets created you can also move it around very quickly. If I want to change the consequences and probability values, I drag and drop the issue elsewhere on the matrix view, simple as that. In the Table view it’s quit easy too, you just hit “Edit” button and change the values.

Configuring and editing your risk cards
Another cool thing in the Risk module is that you can configure how your risk card looks like. It’s available through the box configuration. Check out the screen below:

You can do all kind of things here: delete the entire row risk on the card, add new ones (with one or two columns), use icon-like fields and also configure how the data gets displayed. The user interface is intuitive and simple to use. The right panel allows you to pick from any Jira available field, including custom fields.
You can also use the magnifying glass icon to just put the card on the full-screen kind of mode for presentation purposes.

Very handy thing to use during some risk review meetings with your team or with your board.
And another useful feature is that you can also edit the risk task by just clicking the pencil icon.

Summary and some tips
We know that we are working on JIRA data. We know that we have two views available here. Both of them are pretty useful. We know that we can easily add things to the Risk module, either by creating new issues or adding existing ones and just assigning consequence and probability values to them. We know that we can edit the risk card and that we can enlarge it and use it for presentation purposes. I didn’t mention that there are also quick filters that can narrow down the risk registry if you have quite a lot of them identified. Again, we explain how to use the quick filters, define them, how they work and what they are based on in our training (link at the end of the article). So if you want to learn more, definitely reach out to us about that.
Be smart and get help to get it right
As I mentioned initially, I think that the BigPicture is the best and the most comprehensive project management tool that you can get your hands on in the Jira environment. At the same time, it isn’t a simple tool. It has lots of features that sometimes are hard to discover. We are currently working with the customer who has been working with BigPicture, trying to implement it for the past half a year. They did some demo projects, they did some pilot phase, and they invited us to have a look at their instance to see where they are at, and to learn what else we could do to enhance their experience with the software. We had a session with them just yesterday (as of writing this article), and we took a look at their instance. We noticed that similarly to almost all the clients in the same situation, they are using 30% – 40% of the functionalities that BigPicture provides. They do not understand the depth of features that the tool has. They do not understand very well the connection between BigPicture and Jira. They are not using it properly to their advantage. They are doing lots of things manually where they could be automating, and they are not sure how to present their data correctly for higher management, C-level employees, people that want to have the aggregated views of whatever they are working with, like projects portfolios, programs.
So this is why I strongly advise that if you are thinking about implementing BigPicture, if you are thinking about employing this excellent tool to help you manage projects, programs, portfolios in your company, educate yourself first. It’s worth knowing what is possible before you start designing the solution for your company. And we will probably quite soon record another video where we will be talking about the whole implementation process that we we go through with our customers. It has been proven many, many times, and it works. But for now, remember that professional help might be something that is worth considering.
If you would like to talk with us about how to do it properly or maybe how we could help you in the process, feel free to reach out to us, click here. Drop us a message, we will reach out to you. We can spend a short session with you for free to talk about where you are, what you are searching for, what are your needs, and how BigPicture can help you IF it can help you, because we aren’t saying that it’s perfect for every scenario. We will tell you if it’s a useful tool for you or not, if there is something better on the market, we will give you a better solution to look into and try to give you as much value out of your requirements as possible.
Some useful links:
Contact form
BigPicture training
Our Youtube